
Top 5 KPIs to Measure Robotic Cleaning Success
Summary
Contents
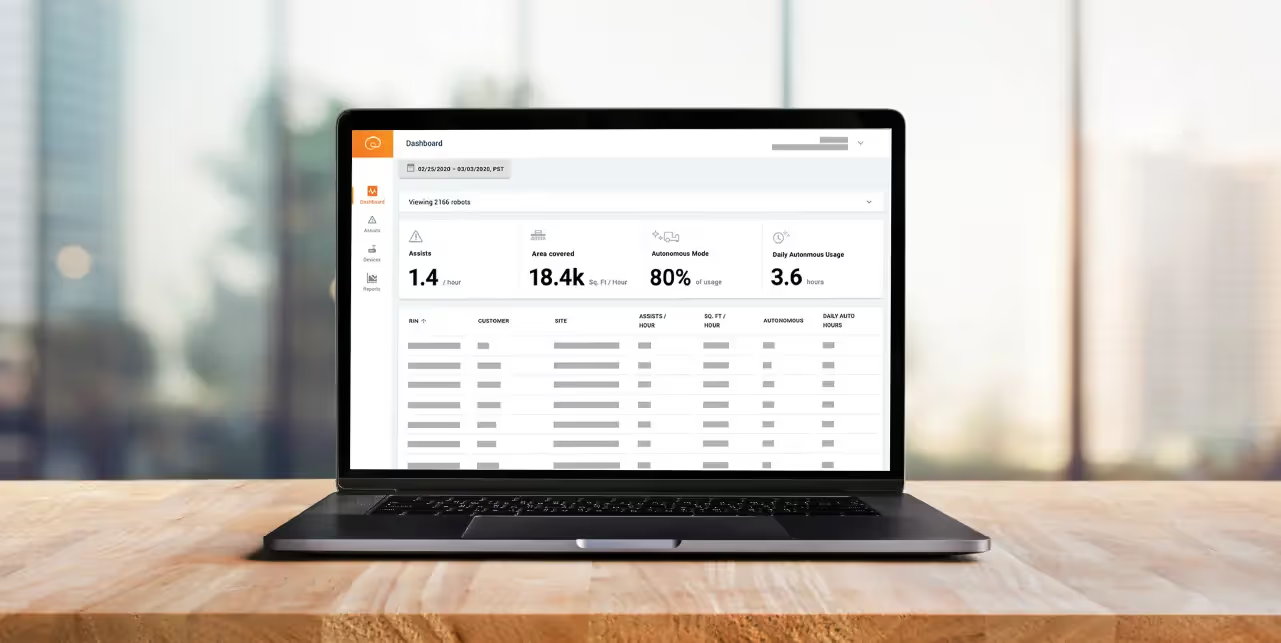
One of the key advantages of using robotic floor scrubbers is the ability to leverage cloud-based operational metrics that can help optimize and verify cleaning performance. This is particularly valuable during the ongoing health crisis, when cleaning has dramatically increased in importance and facilities and operational executives are looking for ways to better manage corporate compliance goals.
As part of its monthly BrainOS Autonomy Service, Brain Corp reports on key operational metrics, made available through a variety of formats, including graphical, web-based dashboards, daily email reports, and more. This is made available to end users, either directly or via our manufacturing partners.
We asked the robotic cleaning experts and the data gurus at Brain Corp to come up with five cleaning KPIs (key performance indicators) based on 1) their experience and 2) what customers are using the most across multiple verticals, including retail, grocery, malls, healthcare, and more. Here’s what they came back with:
- Autonomous Cleaning Coverage — What it shows: How much floor space has been cleaned while in autonomous mode. Why it’s important: It’s a core metric that shows total square footage cleaned per hour/day/week/month, etc. Most facilities have some type of daily or weekly coverage targets to hit, and this enables them to see if those targets were achieved. Regional managers, meanwhile, can compare cleaning coverage across locations, and follow up on questions like: why is one location (store, mall, school, healthcare facility) way below all the others for the day or week?
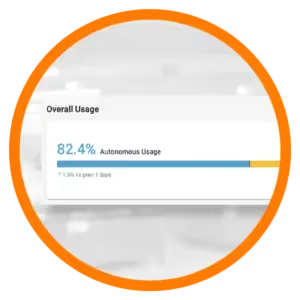
- Autonomous Usage Percentage — What it shows: The percentage of time a cleaning robot is used in autonomous mode versus manual. Why it’s important: it shows how well a company’s robotic investment is being leveraged. A good benchmark for this KPI is 80% autonomous usage over manual usage. Needless to say, it’s always best to ensure staff is maximizing autonomous usage so they can focus on other key tasks while the robot takes care of cleaning the floors.
- Autonomous Hours Per Day — What it shows: Total hours of autonomous usage per day per store and overall. Why it’s important: This is a key metric for understanding not only total autonomous usage, but for how much time you are giving back to employees for other critical tasks that robots cannot do. Use this as a productivity metric by setting a benchmark for minimum autonomous hours per day for staff to hit.
- Number of Cleaning Routes Run — What it shows: Total number of cleaning routes run per day/week, etc. Why it’s important: It shows how many routes were run during any time period. It is important to look at this in addition to autonomous hours per day to make sure staff are running all of the routes and not just repeating one or two routes over and over to meet their goal. Note: This KPI is most applicable for end users that leverage multiple, shorter routes to clean their facilities, as compared to one very long route, which some customers do.
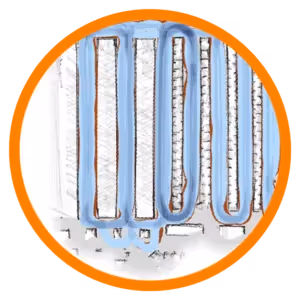
- Visual Heat Maps — What it shows: A visual representation of daily routes cleaned is provided on daily and weekly reports. Why it’s important: With a simple glance, site managers can easily see if daily cleaning routes were achieved, the total runtime, and when routes were started and stopped. The maps show the original trained route, and the path that was achieved autonomously. Looking at the maps it is easy to pinpoint which areas may have been missed due to obstacles or stoppage, and whether routes should be remapped to optimize cleaning coverage.
One of the major benefits of investing in autonomous floor care machines is the ability to get near-real-time cleaning metrics for the first time. This enables facilities and operations staff to optimize and verify performance by location, region or fleetwide. It also allows business leaders to understand the value of their robotic investment in adjusting to new cleaning demands. Brain Corp works with its manufacturing partners to package this data into graphical charts and dashboards. This makes it easy to digest, helping organizations monitor their progress as they adapt to what has become a constant state of clean.
Read our related blog, “The Secret Weapon of Autonomous Floor Care Robots.”
For more information on Brain Corp technology, contact us here.

